+501-880-2833/2832
Direct Call
Exploring Opportunities within North America
Overview:
The North America region comprises the United States of America, Canada and Mexico all of whom are members of the group of twenty (G20) and are a party to the North American Free Trade Agreement (NAFTA).
Countries within the G20 account for more than four-fifths of gross world product and three-quarters of global trade, and home to almost two-thirds of the world’s population[1]. The United States of America is among the top four largest exporting countries and the third largest populated country in the world. Canada and Mexico ranks among the top fifteen exporting countries[2]. Mexico is a larger populated country than Canada – Mexico being the eleventh largest populated country in the world with a population of 120,286, 656 and Canada being the thirty seventh largest country with a population of 34,834,840[3].
NAFTA
The NAFTA is a comprehensive international trade agreement which came into effect in 1994 creating one of the largest Free Trade Zones. The largest being the Trans-Pacific Partnership Agreement (TTP), which has recently concluded its negotiations in 2015, having achieved unprecedented scope and ambition known to date. The NAFTA countries have a combined GDP of US$16.2 trillion and a population of 439.8 million. The combined output of the North American economy is US$17.0 trillion[4]. Languages spoken in this region are: English, Spanish, and French.
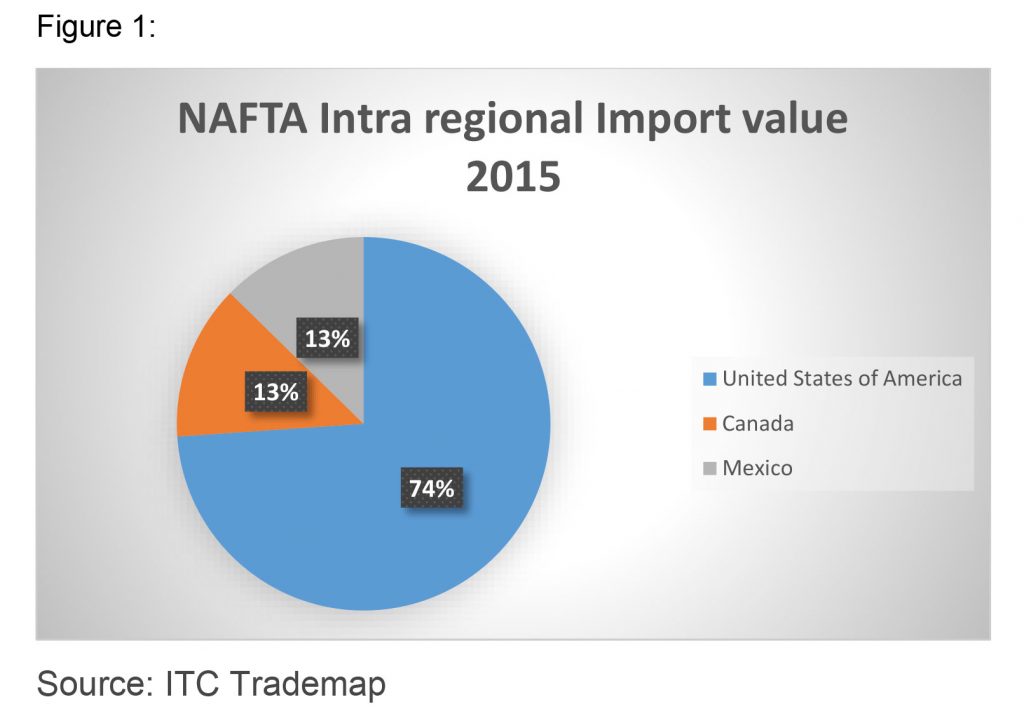
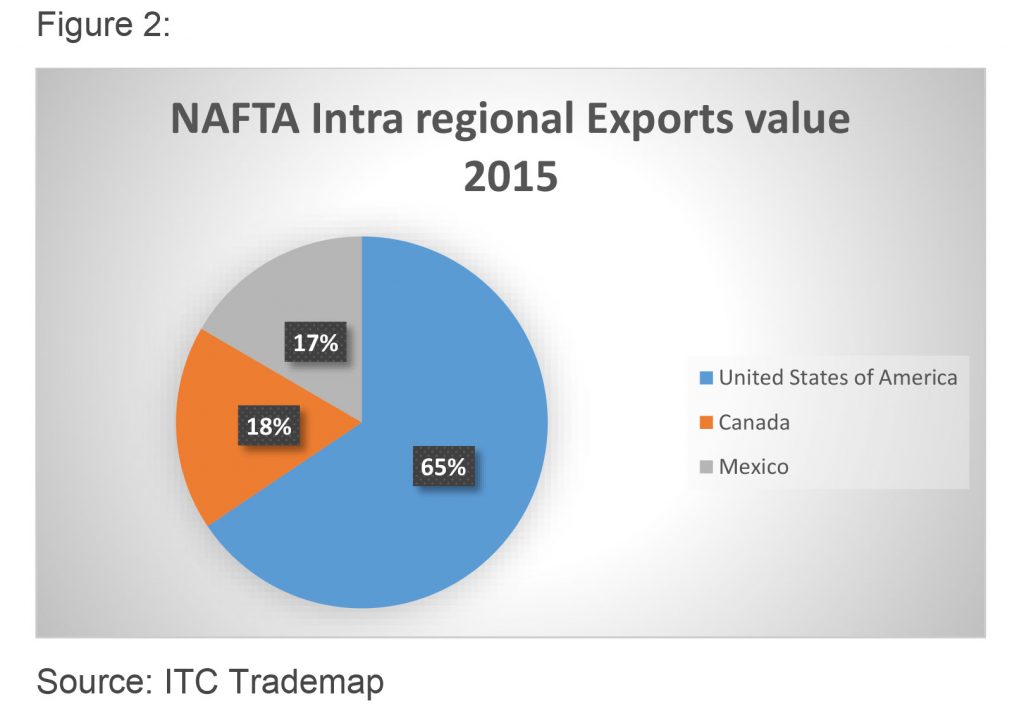
In 2015, the United States accounts for 74% of NAFTA’s total imports while Canada and Mexico accounts for 13% respectively. Total intraregional imports amounts to 3,121,206,345,000.00 (3.121 Trillion) (see figure 1). The United States accounts for 65% of NAFTA’s total exports. Canada accounts for 1% more of NAFTA’s total exports than Mexico (see figure 2). Total intraregional exports amounts to 2,293,275,236,000.00 (2.293 Trillion).
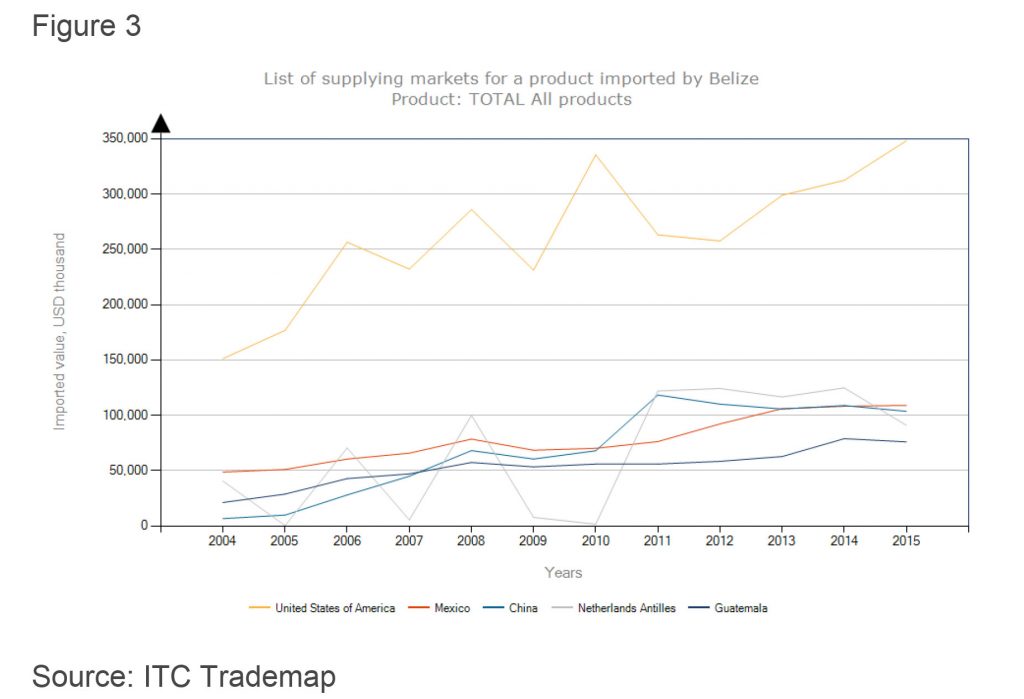
Canada ranks as Belize’s 16th trading partner in 2015 having 0.8% share in Belize’s imports and 0.5% share in Belize’s exports. From the North America region, the United States remain Belize’s number one trading partner followed by Mexico (see figure 3 and 4).
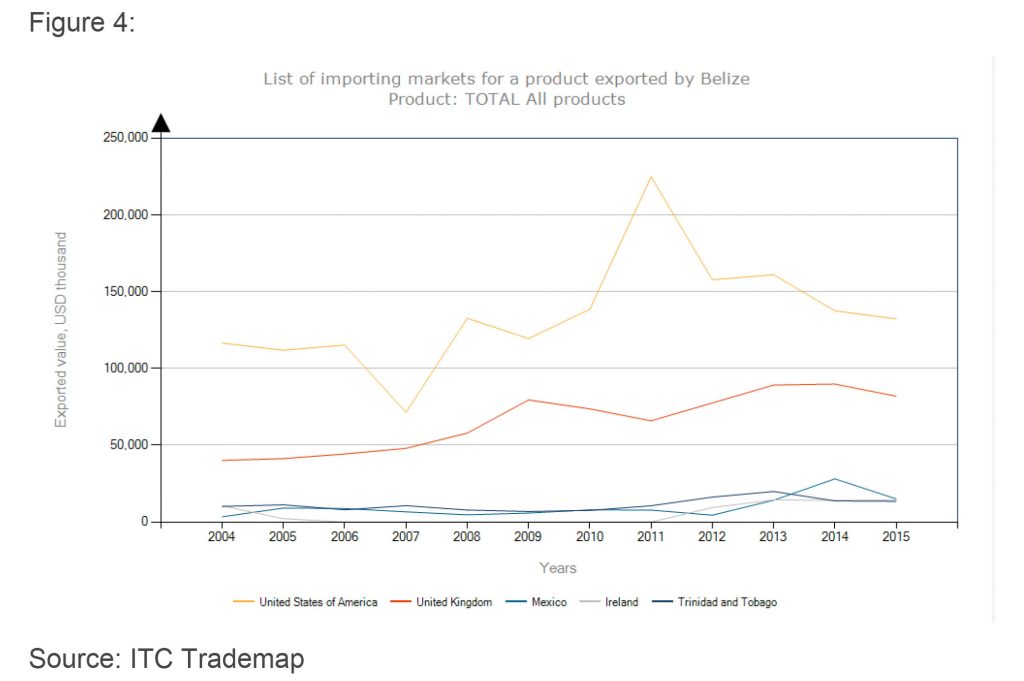
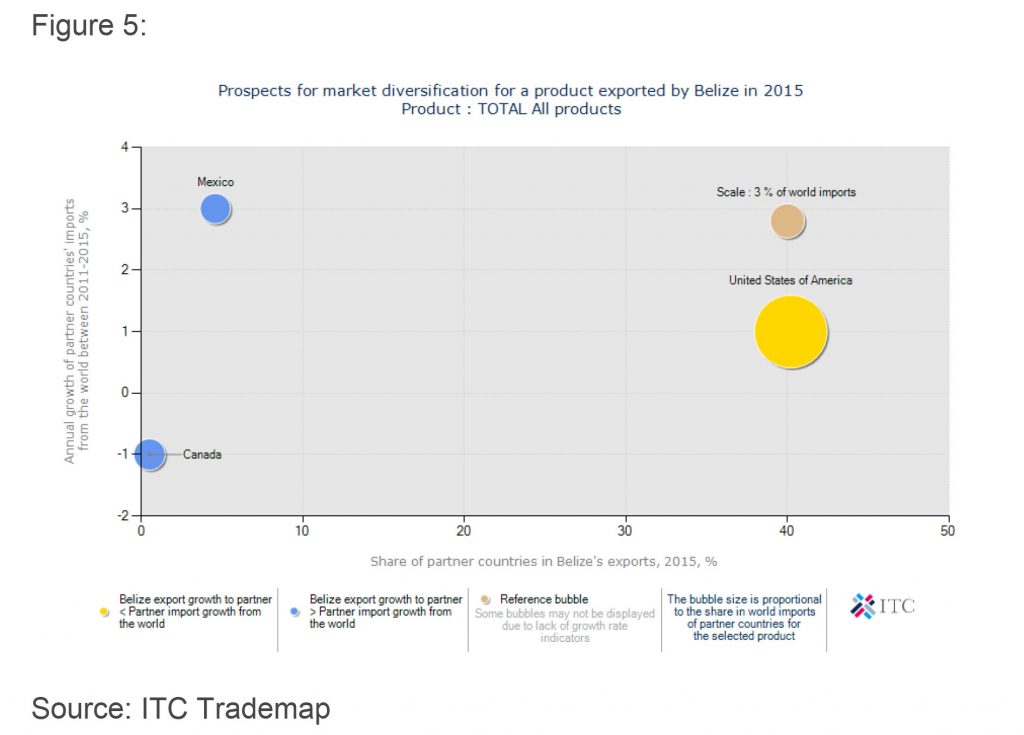
The figure above shows that the share of Canada in Belize’s exports is 0.52% with annual growth of -1% of Canada’s imports. While the share in the world imports is 2.54%, Canada import growth from the world is less than Belize’s export growth to Canada.
With respect to the United States of America, the share in Belize’s exports is 40.22%. Annual growth of the USA imports is 1% while the share of USA imports to the world is 14%. The above figure depicts the USA having greater import growth from the world than Belize export growth to the USA.
The share of Mexico in Belize’s exports is estimated at 4.59% with annual growth of 3% of Mexico’s imports. Mexico’s share in world imports is 2.4. %. Mexico’s import growth from the world is less than Belize’s export growth to Mexico.
The prospects for Market diversification in North America of products exported by Belize lies greater with Mexico and Canada.
CANADA
Canada’s GDP per capita (2015): 43.25k USD
Land Area (2015): 9.09M sq. km
Ease of doing business rank (2017): 22
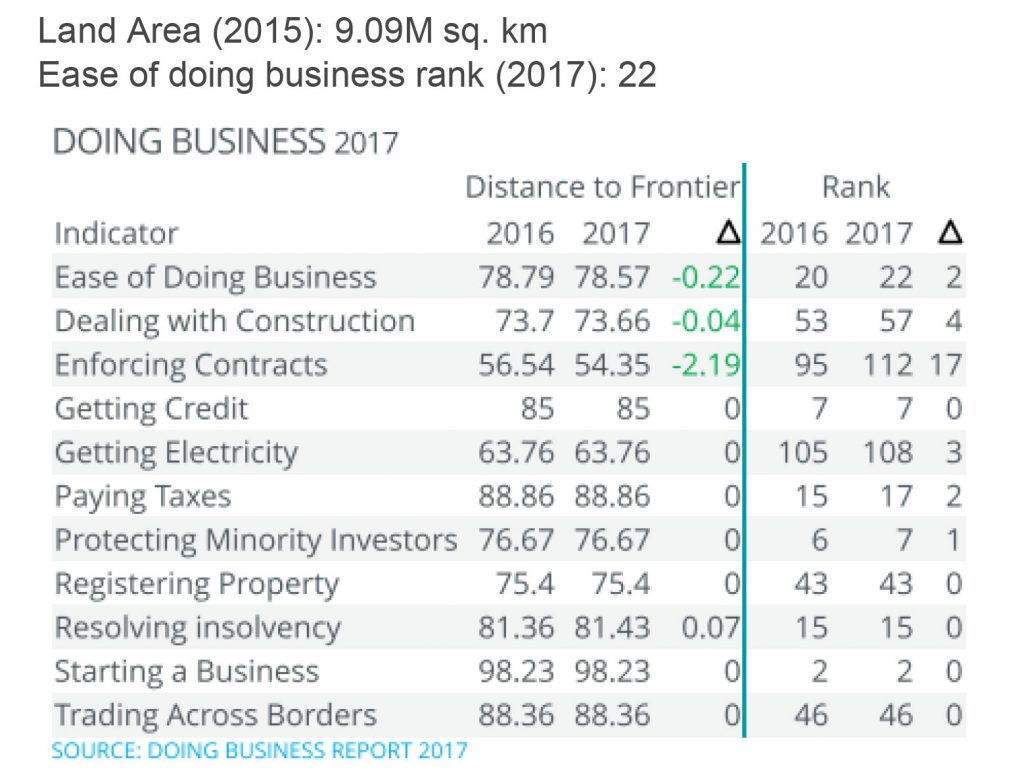
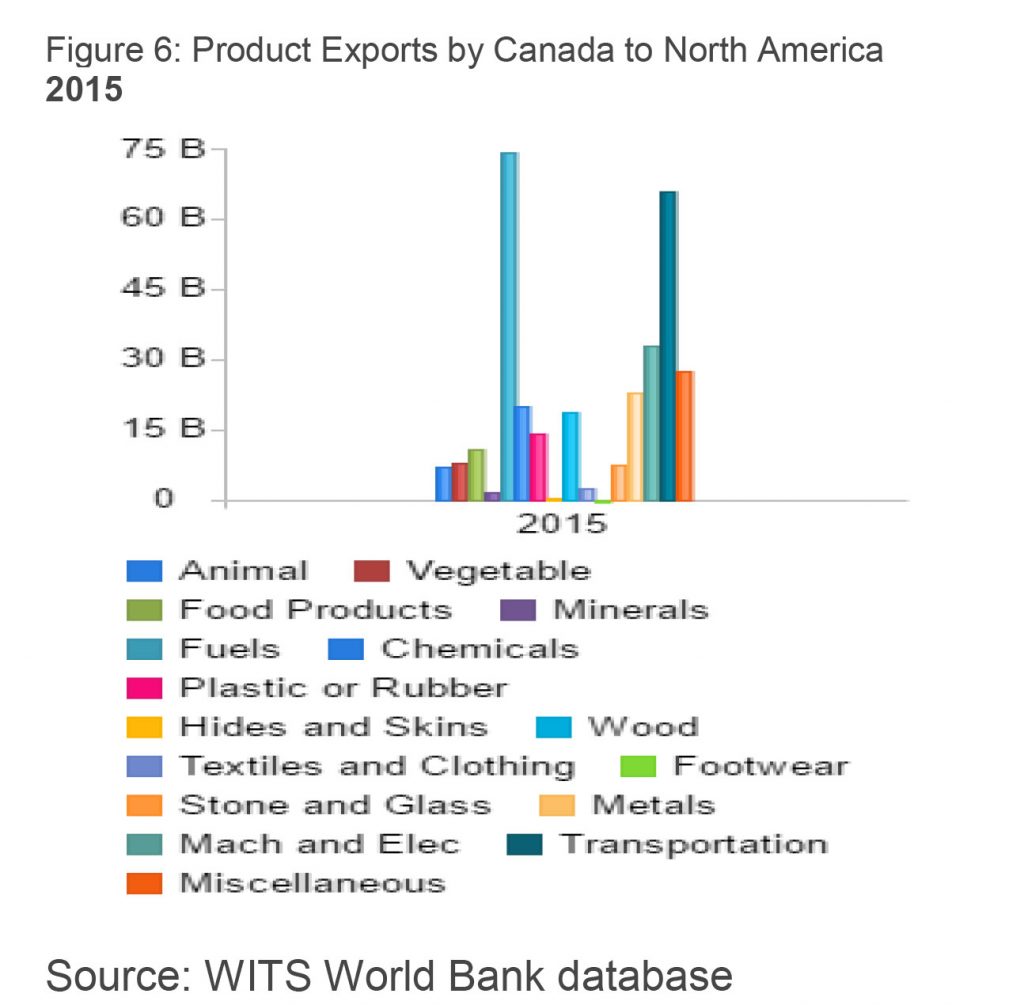
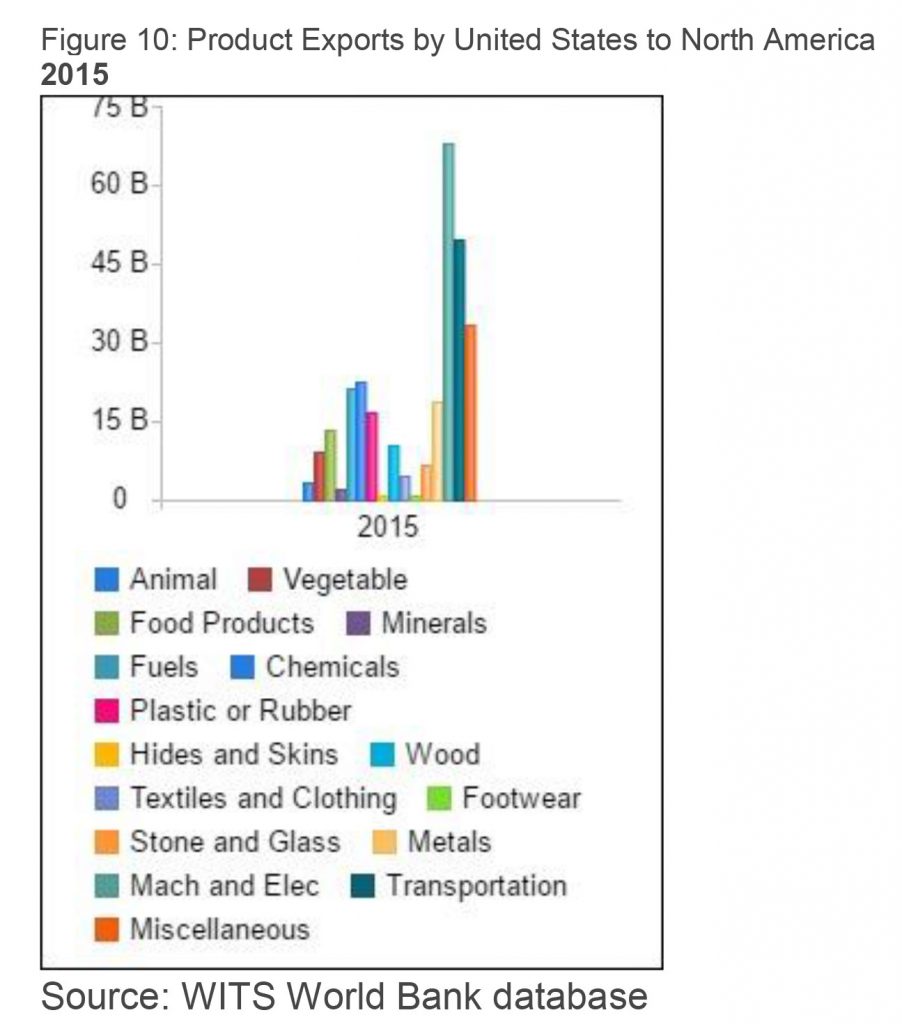
Figure 6 above identifies Canada’s main product of exports to North America that includes: animal, vegetable and food products, fuels, chemicals, plastic or rubber, hides and skins, wood, textiles and clothing, footwear, stone and glass, metals, machines and electrical, and transportation. Canada’s primary export commodities (overall) include motor vehicles and parts, industrial machinery, aircraft, telecommunications equipment; chemicals, plastics, fertilizers; wood pulp, timber, crude petroleum, natural gas, electricity, and aluminium.
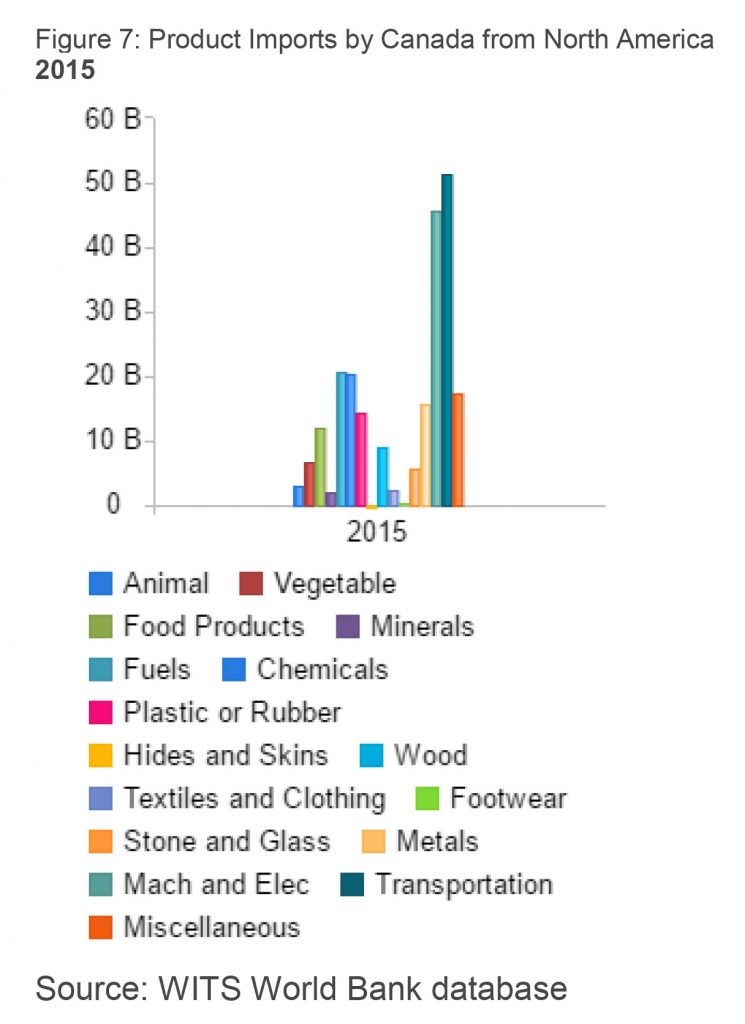
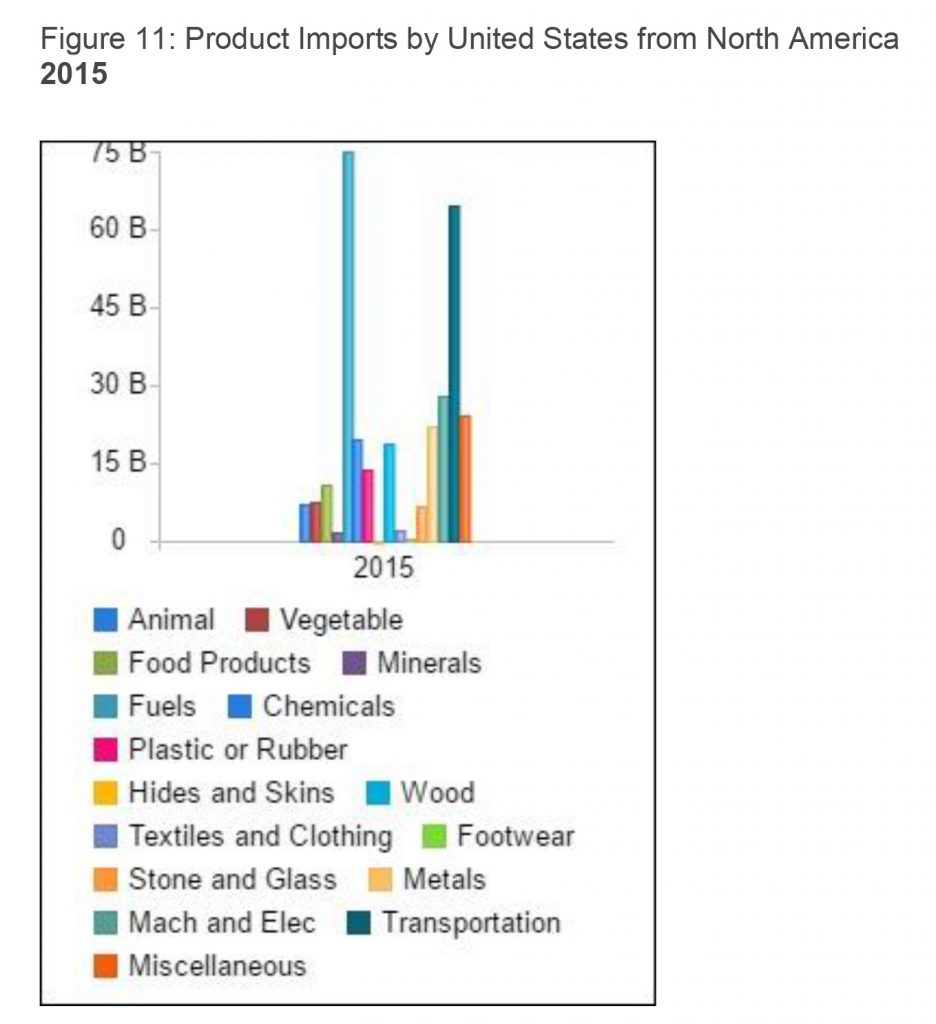
Figure 7 shows those products which Canada imports from North America; these products are similar to those exported. In 2015 the total Transportation imported is valued at USD 51 Billion accounting for the majority of total imports to Canada. Fuels is the second largest import commodity valuing USD 45 Billion.
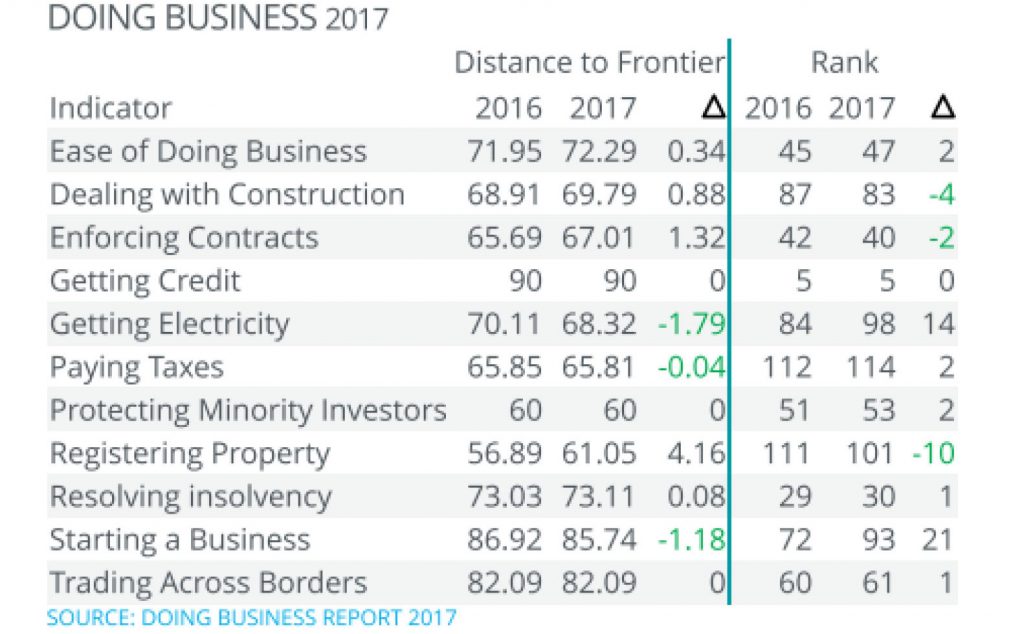
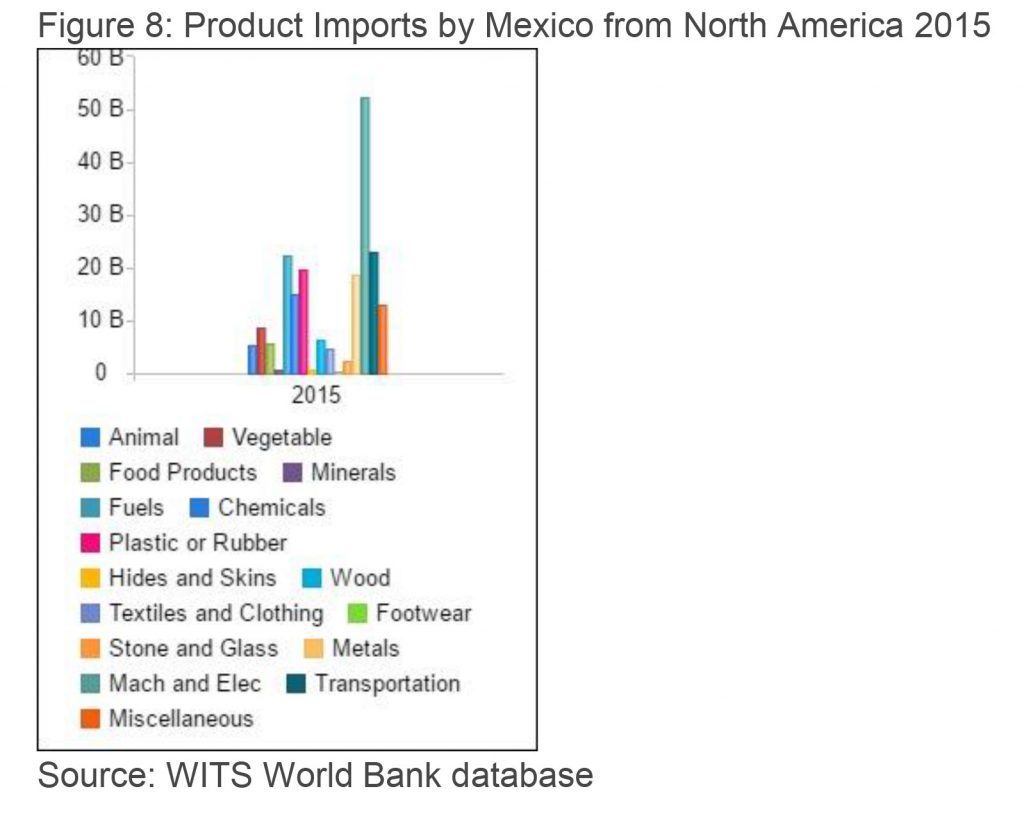
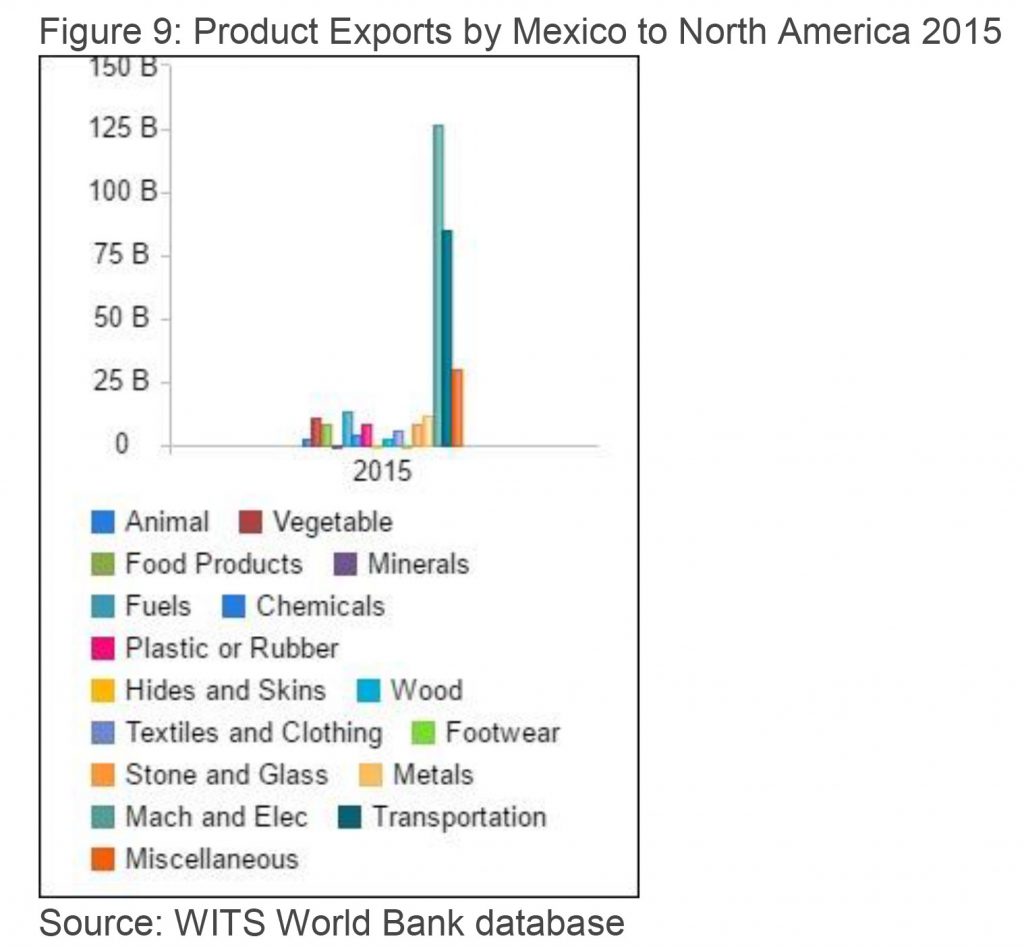
MEXICO
Mexico’s GDP per capita (2015): 9.01K USD
Land Area (2015): 1.94M sq. km
Ease of doing business rank (2017): 47
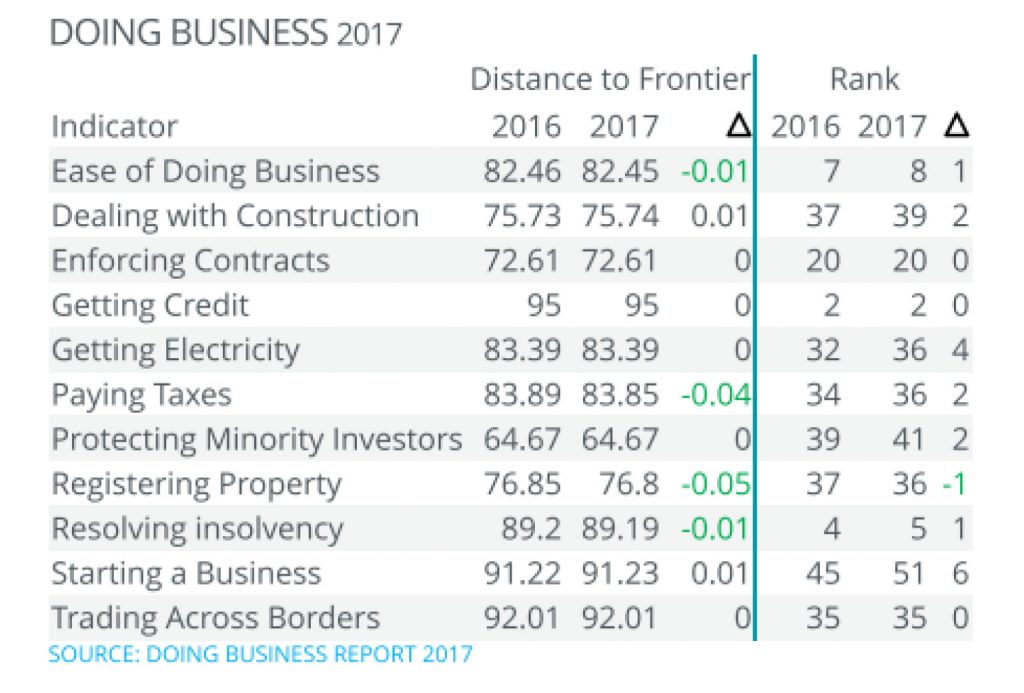
UNITED STATES OF AMERICA
US GDP per capita (2015): 56.12K USD
Land Area (2015): 9.15 M sq. km
Ease of doing business rank (2017): 8
BELIZE
Belize’s GDP per capita (2015): 4.88K USD
Land Area (2015): 22.81 K sq. km
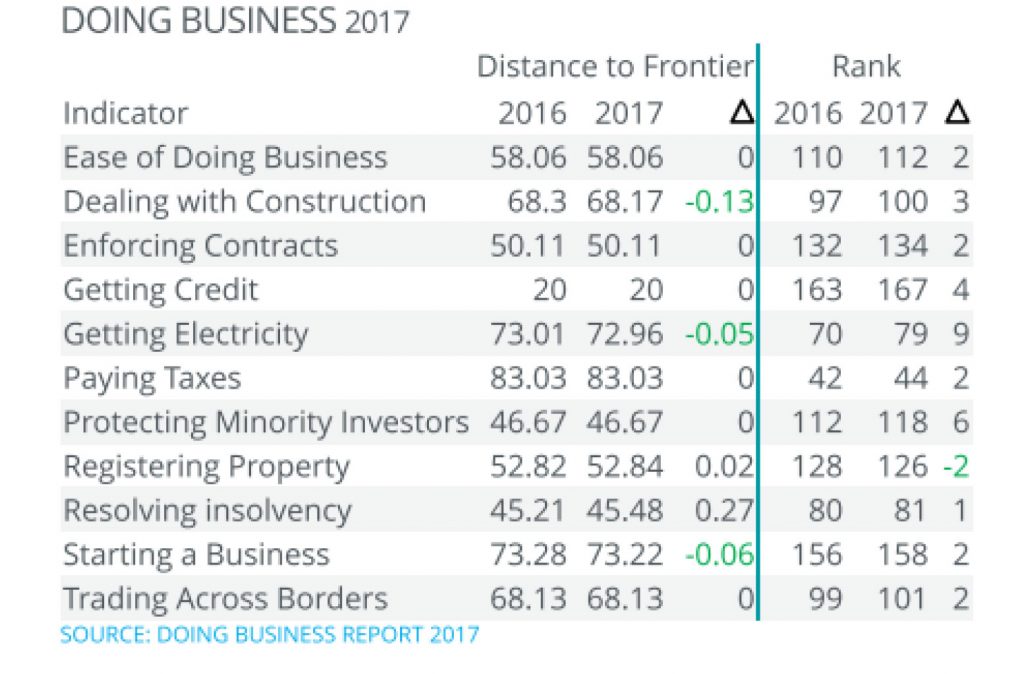
Ease of Doing Business Rank (2017): 112
 Market Access: CBI and CARIBCAN
Belize benefits from two special programs in the North American region which are: the US- Caribbean Basin Initiative (CBI) and the CARIBCAN.
The CBI allows for duty-free access of beneficiary countries, such as Belize, through the Caribbean Basin Economic Recovery Act (CBERA) for most goods until 31st December 2019. CARIBCAN also provides such unilateral duty-free access for most commodities originating in the Commonwealth Caribbean countries and expires on 31st December 2023. The WTO has granted these waivers – a derogation from the Most Favoured Nation principle.
Conclusion:
There are opportunities to expand trade in the North American region in both goods and services. While Belize enjoy preferential trade with the United States and Canada through special arrangements made possible by the CBIA and CARIBCAN, there are much more investment opportunities for both local and foreign investors. Further analysis will be required on a product specific basis.
Quality and food standards must be met by producers in order to enter these markets. Governments must have supportive domestic regulations; coherent domestic services and development strategies; adequate regulatory, institutional and competition frameworks; and necessary infrastructures to support, stimulate, and foster trade.
To date, the Government of Belize has identified the need for institutional strengthening, increasing supply capacity, securing existing arrangements and facilitating trade to realize meaningful growth.
[1] https://www.g20.org/Webs/G20/EN/Home/home_node.html
[2] https://www.statista.com/statistics/264623/leading-export-countries-worldwide/